Averages
Compare mean, median, and mode to stop outliers from distorting your summary statistics.
Compute all three averages and watch for large gaps between them; a mean that drifts far from the median or mode signals that extreme values are pulling the story. Highlighting those divergences steers analysts toward the records that need validation.
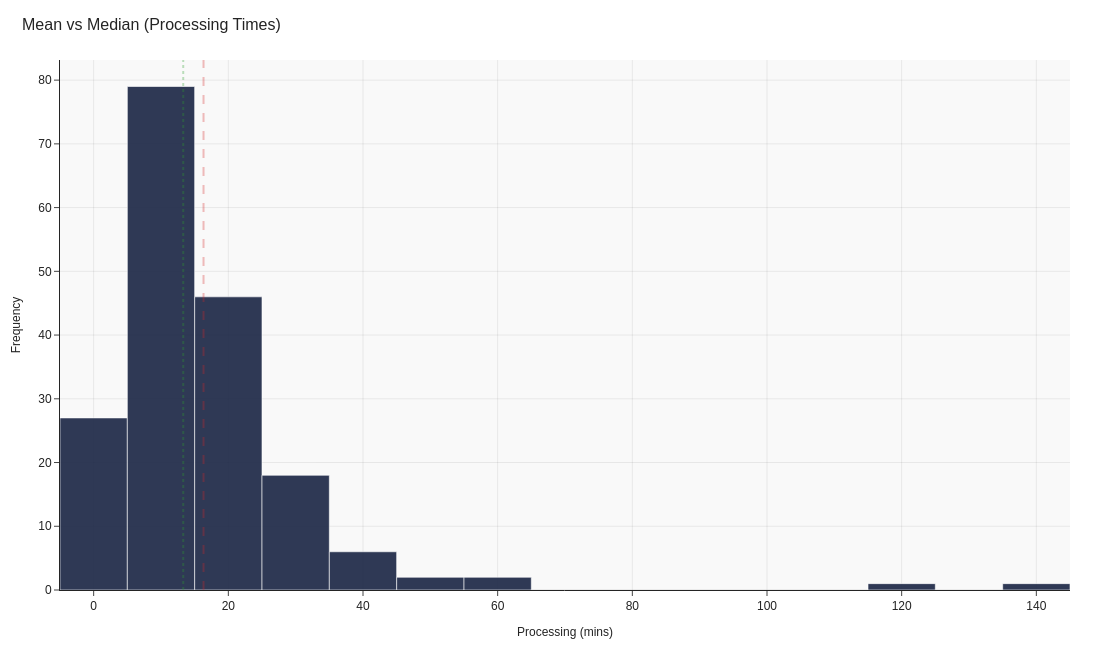
Image source: generate_visuals.py
Code examples
Calculating averages
import pandas as pd

# Order quantities for five recent deliveries
orders = pd.Series([18, 20, 22, 25, 150])

# Compare different centre-point statistics
mean = orders.mean()
median = orders.median()
mode = orders.mode().iloc[0]
print(mean, median, mode)
' Calculate mean, median, and mode
=AVERAGE($C$2:$C$6)
=MEDIAN($C$2:$C$6)
=MODE.SNGL($C$2:$C$6)

' Highlight if the mean diverges from the median
=IF(ABS(Average-Median)>10,"Investigate tail","Normal range")
// Arithmetic mean of the selected orders
Avg Mean = AVERAGE('Orders'[Value])

// Median across all order values
Avg Median = MEDIANX(ALL('Orders'), 'Orders'[Value])

// Mode by counting occurrences of each order value
Avg Mode =
    VAR SummaryTable =
        ADDCOLUMNS(
            VALUES('Orders'[Value]),
            "RowCount", CALCULATE(COUNTROWS('Orders'))
        )
    VAR TopRow =
        TOPN(
            1,
            SummaryTable,
            [RowCount],
            DESC,
            'Orders'[Value],
            ASC
        )
    RETURN
        IF(TopRow = BLANK(), BLANK(), MAXX(TopRow, 'Orders'[Value]))

// Gap between mean and median signals skew
Avg Gap = [Avg Mean] - [Avg Median]
Key takeaways
- Different averages answer different questions.
- Large gaps between metrics signal skew or outliers that need context.
- Always show which average you have chosen and why.