Z Score
Standardise values to a common scale and highlight how far they sit from the mean.
Subtract the series mean from each value, divide by the standard deviation, and monitor the resulting z score. Observations with absolute z scores beyond your tolerance—typically three—are treated as outliers because they sit multiple standard deviations from typical performance.
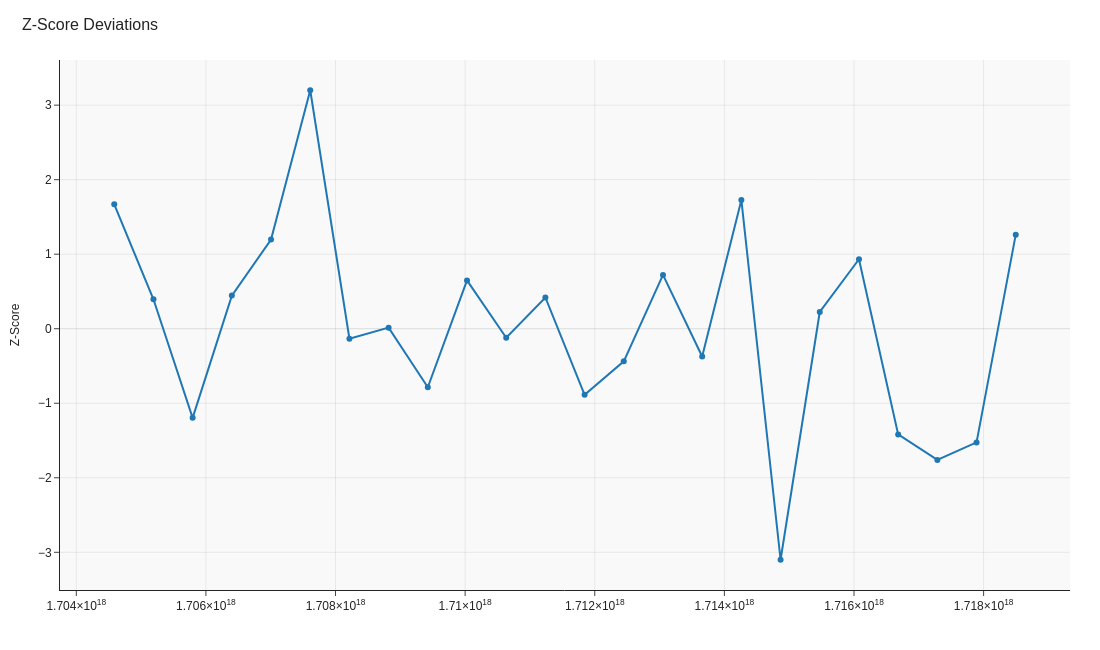
Image source: generate_visuals.py
Code examples
Calculating z scores
import pandas as pd

# Metric values to monitor (e.g. daily throughput)
metric = pd.Series([45, 47, 50, 52, 120])

# Compute z scores relative to the sample mean and standard deviation
mean = metric.mean()
std = metric.std(ddof=1)
z_scores = (metric - mean) / std

# Tag observations that exceed three standard deviations
alerts = metric[abs(z_scores) > 3]
print(alerts)
' Z score for each observation
=(A2 - AVERAGE($A$2:$A$101)) / STDEV.S($A$2:$A$101)

' Flag z scores outside ±3 standard deviations
=IF(ABS(ZScore)>3,"Investigate","OK")
// Mean and standard deviation of the KPI
Z Mean = AVERAGE('KPI'[Value])
Z Std = STDEVX.P('KPI', 'KPI'[Value])

// Z score for the current context
Z Score = DIVIDE(AVERAGE('KPI'[Value]) - [Z Mean], [Z Std])

// Flag values with |z| > 3
Z Flag = IF(ABS([Z Score]) > 3, "Alert", "Within")
Key takeaways
- Z scores translate different metrics onto the same scale.
- They rely on a roughly normal distribution, so check the shape first.
- Explain the chosen threshold so stakeholders understand the alert volume.