Introduction to Outliers
Outliers are the shipments, orders, or costs that behave unlike the rest — the start of every investigative story.
Begin by plotting the full distribution so unusual points stand in context, then validate each anomaly with domain experts before deciding whether to keep, explain, or exclude it. The process blends statistical cues with narrative confirmation to avoid misclassifying legitimate events.
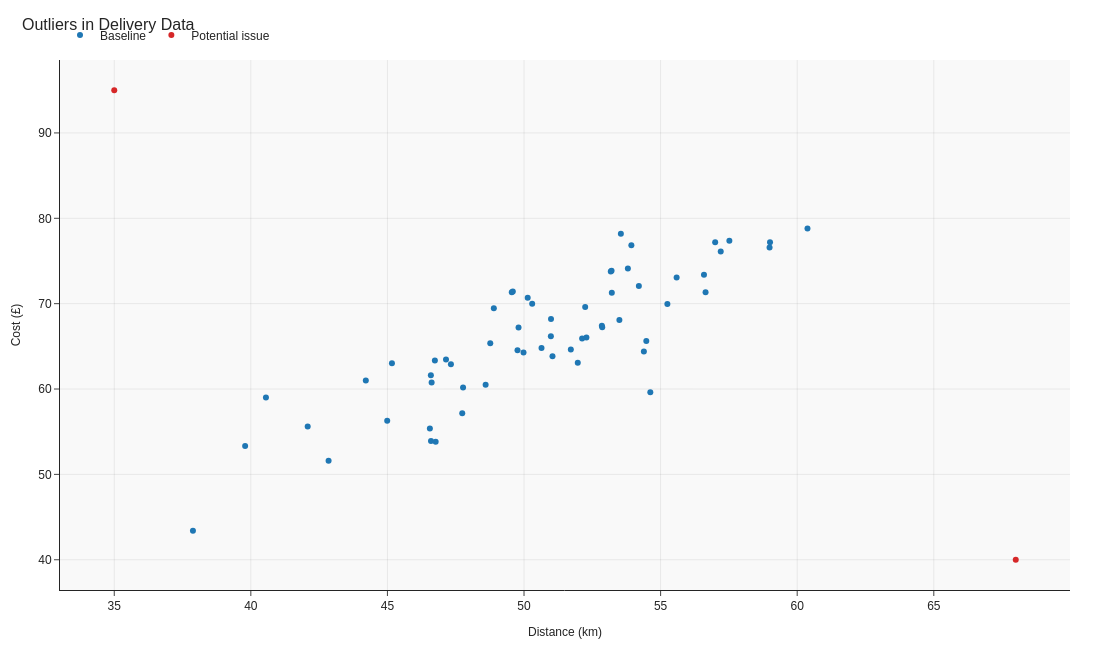
Image source: generate_visuals.py
Key takeaways
- Plot the full distribution so true anomalies stand out from healthy variation.
- Validate unusual points with subject matter experts before calling them errors.
- Annotate outliers to turn statistical surprises into memorable business stories.